News
Hong Kong office rents to drop by up to 10% more over the next year

This is after rents have fallen by 11.9% over the first three quarters of 2020. The city’s Grade A office vacancy rate rose to 6.8% at the end of September 2020, from 4.7% at the end of 2019. According to Savills, the surging vacancy rate during the period was attributed mainly to worldwide economic recession, which has inevitably resulted in corporate downsizing and the surrender of office space. Decentralisation continues to prevail with more Central-based financial and business services firms moving to other districts (e.g. Wan Chai/Causeway and One Island East). Most businesses have resumed normal working patterns but some multinationals are still allowing staff to work from home. Here’s more from Savills: Retail and hospitality have been greatly impacted by the pandemic, together with finance and business services. This is reflected in the rising vacancy rate in the CBD. Medical and online businesses are examples of sectors that have been relatively less affected. In order to attract tenants, landlords are currently offering longer rent-free periods as an incentive, rather than shortening the lease term to less than the typical term of three years. Developers and investors are more cautious when considering land acquisitions, and the Development Bureau recently delayed the tender of New Central Harbourfront Commercial Site 3. We expect rents to fall by a further 7.5-10% in a year’s time, after rents have fallen by 11.9% over the first three quarters of 2020. The vacancy rate is expected to continue rising given sluggish leasing activity and 1.4 million sq ft of new supply due to complete in 2021. What advice would Savills give a 30,000 sq ft CBD occupier with a lease event in 12 months’ time? The occupier should start the planning process (e.g. solicit and consider options) now since many 30,000 sq ft CBD occupiers start their search for available options one year before expiry. Typically, it requires six to nine months for the entire renewal/relocation decision.
Hong Kong office rents to drop by up to 10% more over the next year
This is after rents have fallen by 11.9% over the first three quarters of 2020. The city’s Grade A office vacancy rate rose to 6.8% at the end of September 2020, from 4.7% at the end of 2019. According to Savills, the surging vacancy rate during the period was attributed mainly to worldwide economic recession, which has inevitably resulted in corporate downsizing and the surrender of office space. Decentralisation continues to prevail with more Central-based financial and business services firms moving to other districts (e.g. Wan Chai/Causeway and One Island East). Most businesses have resumed normal working patterns but some multinationals are still allowing staff to work from home. Here’s more from Savills: Retail and hospitality have been greatly impacted by the pandemic, together with finance and business services. This is reflected in the rising vacancy rate in the CBD. Medical and online businesses are examples of sectors that have been relatively less affected. In order to attract tenants, landlords are currently offering longer rent-free periods as an incentive, rather than shortening the lease term to less than the typical term of three years. Developers and investors are more cautious when considering land acquisitions, and the Development Bureau recently delayed the tender of New Central Harbourfront Commercial Site 3. We expect rents to fall by a further 7.5-10% in a year’s time, after rents have fallen by 11.9% over the first three quarters of 2020. The vacancy rate is expected to continue rising given sluggish leasing activity and 1.4 million sq ft of new supply due to complete in 2021. What advice would Savills give a 30,000 sq ft CBD occupier with a lease event in 12 months’ time? The occupier should start the planning process (e.g. solicit and consider options) now since many 30,000 sq ft CBD occupiers start their search for available options one year before expiry. Typically, it requires six to nine months for the entire renewal/relocation decision.
Non-landed private home prices in Singapore up 0.1% in Q3
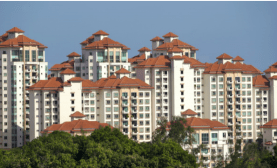
The slight growth was driven by the price increases in RCR and OCR. Alongside surging transaction volumes, private home prices also defined the negative impact brought on by COVID-19. According to the URA’s latest statistics, the island-wide price index of non-landed private residential properties inched up by 0.1% QoQ in Q3/2020. By market segment, the overall price growth was fuelled by the rest of central region (RCR) and outside central region (OCR), which posted quarterly growth of 2.5% QoQ and 1.7% QoQ respectively. Relatively higher prices achieved in newly launched projects compared to the vicinity was the main reason behind the increase. In contrast, prices in the CCR experienced a contraction of 3.8% QoQ. Lower prices in resale transactions, together with limited new sales, could be blamed for the price drop in this market segment. The average prices of high-end non-landed private residential projects in Savills’ basket also fell in the reviewed quarter, though at a much moderate pace of 0.2% QoQ. Year-to-date, prices registered a marginal 0.9% decline. The decline should also be seen in the context of a limited number of transactions, inferring that the sellers in our basket of high end non-landed properties are not under great duress to offload their properties. Supply Based on the data released by the URA, there was a total supply of 50,369 uncompleted private residential units in the pipeline with planning approvals in Q3. About 52.6% of this pipeline supply, or 26,483 units remained unsold at the end of Q3/2020. This is about 5.3% lower than the 27,977 in the previous quarter.
Regional specialty rents in Australian retail to decline 11.4%: JLL

Department store rationalisation will significantly contribute to rising vacancy and falling rents. Shopping centres were once synonymous with fashion, but now this is changing. According to JLL, fashion or apparel retailers still make up around a quarter of specialty tenancies across Australian shopping centres (excluding large format retail). There are over 15,000 specialty stores across the fashion sector, including both privates and national chains, domestic and international retailers, and also footwear and accessory retailers. Here’s more from JLL: Apparel retailers account for the greatest proportion of specialty GLA (gross lettable area) across CBD, regional and sub-regional assets. However, leasing demand from apparel tenants has been moderating for several years, and COVID-19 has accelerated many existing pressure points for this category of retailers. Fashion spending is highly discretionary and long-term patterns show Australians are allocating less of their household budget towards fashion-related purchases. Prior to the COVID-19 pandemic, the clothing, footwear and personal accessory retail category comprised 7.9% of total retail spending (2019, ABS). Fashion’s share of retail spending has gradually trended downwards from 10.5% recorded in 1985. This decline in fashion spending is largely due to price deflation, which has been driven by improvements in production efficiency and rising domestic and offshore competition over the past 20 years. This has resulted in the increased availability of cheaper items. Apparel retailing has also been the most volatile category of spending during the COVID-19 pandemic. In the month of April, apparel spending fell 53.6%, before rebounding 129.2% in May. As of August 2020, apparel spending has declined by 8.6% y-o-y. The Australian fashion industry is facing a range of challenges, as reflected by the growing number of insolvencies in the industry with nearly 600 fashion stores across major retailers exposed to voluntary administration in 2020 so far. The highly competitive environment is leading to price and margin pressure, which is impacting retailers’ ability to pay rent. Strong competition and supply chain disruption are also challenging the e-commerce space. Pure-play fashion-tech retailers are attracting high levels of capital, but investments are not always paying off. An analysis by McKinsey (2020) showed that a $100 investment in fashion-tech IPOs over the past two years would now be worth $73. Fashion e-commerce has also not been immune to voluntary administrations. Global online fashion retailer, Nasty Gal, raised USD 40 million in 2012, but then filed for bankruptcy in 2016. Similarly, Australian athleisure online retailer, Stylerunner, entered voluntary administration in 2019 before being bought by Accent Group, a listed retailer with 524 stores. Interestingly, omni-channel retailing has been part of Stylerunner’s recovery. The retailer is opening its first brick-and-mortar store (280 sqm) in an affluent neighbourhood precinct (Armadale, Melbourne) in late 2020, with further openings anticipated in 2021. Competitive pressures in the fashion industry have resulted in a number of apparel retailers seeking to downsize their networks as they migrate more sales online. The first is insolvency-driven rationalisation, where a business is closed or restructured with a reduced network, and the second is strategic rationalisation, where the retailer chooses to downsize its store network to improve profitability. While there is expected to be a significant amount of store rationalisation within the industry, the stores that retailers retain will look and feel very different to their traditional format. One of the largest challenges that retailers face is blending online with offline, both in terms of how customers interact with stores and how store performance metrics are assessed. The success of performance tracking will in turn influence leasing demand and rental affordability. The apparel industry has become highly dynamic, which has disadvantaged many legacy retailers that hold a significant amount of Australian shopping centre floor space. COVID-19 has accelerated the financial impacts of these pressures and an increase in retail vacancy is anticipated as these retailers rationalise space, either because of formal restructuring or store network rightsizing. Department store rationalisation will also significantly contribute to rising vacancy and falling rents. JLL forecasts that regional specialty rents will decline 11.4% peak-to-trough in the current cycle, implying a negative re-leasing spread of 23.4% for five-year leases with 4% fixed annual increases. With the future of larger shopping centres likely to be centred on human interaction and experience, there are a number of backfill uses for former fashion store space that will support the transformation of the industry. Fashion is not completely leaving shopping centres, but it will be a smaller component and look entirely different as brands strive to provide convenience and experience. Read the full report here.
Tokyo multifamily asking rents down 1.5% in Q3

Rents are still comfortably above levels seen just prior to the Global Financial Crisis. In order to illustrate trends in the central Tokyo residential market, Savills has segmented Tokyo’s 23 wards into seven distinct geographical areas: Central (or “central five wards”), South, West, North (Inner and Outer) and East (Inner and Outer). After reaching a record high, Savills reveals average rents for the 23W and C5W have contracted for two consecutive quarters for the first time since 2016 and have fallen below their four-period moving averages, possibly indicating that the market has entered a downturn. Indeed, it appears that latent demand has yet to manifest following Tokyo’s soft lockdown in April and May. Here’s more from Savills: With an ongoing COVID-19 outbreak in the capital, many companies are continuing remote working arrangements whilst major universities intend to do the same in the form of an online semester. The population of Tokyo Prefecture has thus remained flat since reaching a high watermark of 14 million in May. This, combined with restrictions on prospective foreign residents entering the country, has disrupted demand for residential units in the 23W. While landlords may find less demand for vacant units over the coming months, most can rest assured that their tenanted properties will maintain stable performance for the time being. Japan’s unemployment rate stands at 3.0% as of August 2020, only 0.8ppts higher than its record low of 2.2% in December of last year. As such, tenants should generally have the capacity to pay their current rents. That said, labour demand has clearly fallen, with the job-to-applicant ratio dropping from 2.08x in December 2019 to 1.22x as of August. This will inevitably weigh on incomes and put downward pressure on rental growth going forward. As rents generally fell faster in the outer submarkets in Q3, the C5W’s premium has expanded by 1.1ppts to 18.5%. Only the Outer East submarket posted growth for the quarter, perhaps because of its affordability. This contraction is not occurring across the board, however, as larger units and layouts with multiple rooms have seen rents grow so far this year. Average occupancy in the 23W remains comfortably high, rising 0.2ppts QoQ to 96.6%. The number of residential listings continues to increase, however, suggesting that a disruption to leasing demand may lie ahead. Though leasing activity resumed following the April and May lockdown, it remains somewhat slower than in previous years. C5W occupancy falling below 95% is a case in point. Indeed, pent-up demand was not as robust as landlords had originally hoped and this is likely to be true until at least the end of the year. MID-MARKET RENTAL TRENDS BY SURVEY AREA Average multifamily asking rents for the 23W have fallen by 1.5% QoQ, landing at JPY4,076 per sq m as of Q3/2020. Rents are still 0.8% higher YoY, remaining comfortably above levels seen just prior to the Global Financial Crisis. In a reversal from the previous quarter, rents in the C5W saw a less pronounced drop of 0.5% QoQ and remain 1.8% higher YoY. Some of the more expensive submarkets in the 18 outer wards (18W) pared back the rental gains made last quarter, though all submarkets have maintained higher rents on an annual basis. Each ward in the C5W – save for Shibuya – experienced a quarterly decline in average rents. With Minato’s rents declining 2.0% QoQ and those of Shibuya rising 2.0% QoQ, the latter has once again taken the top spot for average rents in Tokyo. In fact, following steady growth over the past year, the submarket has seen an 8.0% YoY increase in rents, second only to the highly-discounted Edogawa in the Outer East submarket. Following nine consecutive quarters of growth, the South submarket saw rents remain more or less flat in Q3/2020, falling just 0.1% QoQ to JPY4,168 per sq m. As in the previous quarter, Meguro marked the strongest growth – coming in at 1.4% QoQ and 7.6% YoY. Rents in the ward are now higher than those of both Chuo and Shinjuku in the C5W. The number of new-unit listings in Meguro has nearly doubled over the past year, potentially contributing to this gain. The ward’s proximity to Shibuya and Minato, combined with the availability of green spaces and a charming riverfront, could be making the area more attractive in the wake of COVID-19. However, the high number of new-unit listings could imply less demand and rents could fall once these units are leased out. Nearby Shinagawa gave back some of its recent gains with a 2.2% drop in rents over the quarter. All wards in the South still have higher rents on an annual basis. After demonstrating impressive annual growth of 8.2% as of last quarter, the Inner North submarket saw a pullback in rents during Q3. Specifically, rents fell 3.1% QoQ – the most significant decline of any submarket this quarter. This pullback was led by Bunkyo, which, after posting robust growth of 4.4% last quarter, saw those gains disappear with a 4.8% QoQ contraction this time around. Despite this significant drop, rents across the ward remain 5.1% higher on an annual basis. Nearby Toshima posted a milder contraction of 1.2% QoQ, though the ward’s performance on an annual basis is far less impressive. On the other hand, given the ward’s significant discount to both adjacent Bunkyo and the C5W, and strong commercial development pipeline, there may be more upside potential in Toshima in the years to come. The Inner East submarket has similarly seen a contraction after a period of robust growth, with rents falling 1.6% QoQ, but still up 4.0% YoY. With the largest rental growth last quarter, Sumida saw the most significant decline in rents this quarter, falling 4.2% QoQ. Average rents in the ward are still up 4.8% YoY, however. Taito and Koto marked YoY growth of 4.4% and 3.0%, respectively, though rents in the former fell 0.5% while those of the latter remained flat on a quarterly basis. The West submarket felt a mild contraction of 0.5% in Q3/2020, and average rents now stand at JPY3,682 per sq m. Nakano, which led the submarket’s growth last quarter, saw rents fall by 0.3%, while those of nearby Suginami remained flat. Rents in Nerima, the most discounted ward in the submarket, declined by 1.2% QoQ. Each ward in the submarket is maintaining higher rents on an annual basis, with Nakano taking the lead at 4.9%. The ward appears to have many times more listings than in the same quarter last year, which is likely a key contributor to its robust annual performance. As in Meguro, however, the spike in new listings could indicate a drop in demand, while also setting the ward up for a larger contraction in rents next quarter. The Outer North submarket saw rents soften once again after a 0.6% QoQ drop. Itabashi continues to see its rents recover somewhat after falling from a historic high in Q3/2019, posting growth of 0.9% QoQ but still down 5.7% YoY. Kita experienced a softening of 2.0% QoQ, but still maintains a 6.8% premium over the same period last year. The Outer East, the 23W’s cheapest submarket, was once again home to the strongest growth of all surveyed submarkets this quarter, with rents increasing 2.3% QoQ and 4.6% YoY to JPY3,129 per sq m in Q3/2020. Each ward in the submarket save for Katsushika saw growth this quarter. In a divergence from last quarter, Edogawa, the least expensive ward in the 23W, saw rents grow 8.7% QoQ, the strongest growth of any ward in Tokyo this quarter. This appears to have largely been an upward correction given that Edogawa saw rents decline in the first two quarters of the year. As such, despite its quarterly contraction, Katsushika still produced annual growth of 7.8%. The Outer East is the most suburban submarket in the 23W and recent rental growth here may reflect a growing preference for a less urban environment and more affordable areas. Recent occupancy trends add some validity to this argument.
Auckland records fastest rising prime residential prices at 13% in the year to Q3

Manila is a close second with a 10% increase in prime prices. A surge in demand post-lockdown as luxury homeowners re-evaluate where they want to be and the type of property they want to live in has boosted sales and supported luxury prices across several key markets. According to Knight Frank, the index increased by 1.6% in the year to Q3 2020 with 62% of cities continuing to see prime prices increase year-on-year. That said, the percentage of cities registering annual price declines is creeping up, from 23% at the end of 2019 to 38% in Q3 2020. Here’s more from Knight Frank: Auckland (13%) leads the index, but what is notable is the resilience of a number of cities including Manila (10%), Seoul (7%), the Swiss cities of Zurich (7%) and Geneva (6%), Stockholm (5%) as well as the recovery of Chinese cities such as Shenzhen (9%) and Shanghai (6%). It is perhaps not surprising that traditional safe havens, countries that are considered to have handled the pandemic efficiently or applied a lighter touch, plus those markets that are already witnessing an economic rebound have moved higher in the rankings. With travel restrictions in place across much of the world this demand remains primarily domestic in nature. North America not only has three cities in the top ten annual rankings – Toronto (8%), Vancouver (7%) and Los Angeles (6%) but the region has snatched the crown of strongest-performing world region from Australasia this quarter. Vancouver’s recovery continues to surprise having sat low in the rankings for the last four years following the introduction of a 20% foreign buyer tax. Low mortgage rates and pent up demand released post-lockdown saw sales across Greater Vancouver reach 3,643 in September, up 56% year-on-year. In an age of uncertainty, buyers are looking more favourably at luxury property, mirroring what we saw in 2008. With equity markets volatile, Brexit looming large, the repercussions from the US presidential election expected to rumble on, and further waves of the pandemic hitting Europe and the US, property’s credentials as a safe and tangible asset class are rising to the fore.
Hong Kong residential transaction volumes up 15% to 5,024 units in September

But the economic recession and mounting market uncertainty continued to weigh on housing prices. With the COVID-19 outbreak easing and some of the social-distancing restrictions lifted, purchase sentiment in the residential market improved. Knight Frank reveals the sales market became more active in September, with transaction volume increasing by 15% MoM to 5,024 units. The primary market, in particular, was under the spotlight, given a number of new project launches, including CK Asset’s Sea to Sky in Lohas Park, Sun Hung Kai Properties’ Wetland Seasons Park in Tin Shui Wai, and ITC Properties and URA’s Hyde Park in Cheung Sha Wan. Here’s more from Knight Frank: Most recently, the first two batches of flats at New World Development and MTR’s The Pavilia Farm in Tai Wai was heavily oversubscribed by 57 times, the highest subscription rate since 1997. However, the economic recession and mounting market uncertainty continued to weigh on housing prices. According to the latest official statistics, overall residential prices dropped by 1.1% MoM in August. This was the largest decline since February, resulting in a price gain of only 0.4% so far this year. In the luxury market, some homebuyers successfully leveraged the price correction amid a more volatile market to get on the property ladder, most targeting apartments priced at HK$20–30 million. The leasing market regained momentum during the month. Flats that were put on the market were leased out quickly since landlords were willing to negotiate. There were more enquiries from expatriates who plan to come to Hong Kong early next year. Serviced apartments offered deeper discounts, as they faced competition from hotels offering long-stay promotion packages and other attractive offers. Looking ahead, the primary sales market is expected to remain active with a few new projects scheduled for launch in the fourth quarter. Developers may provide more incentives and discounts to speed up sales before the year end. With more units available for sale and protracted negative market factors, we expect housing prices to drop by 3–5% in the rest of 2020.
Industrial strata sales volume in Singapore more than doubled to 372 in Q3

It’s a reversal from a four-quarter decline which began in Q3 2019. The uptick was mainly lifted by an uptick in strata sales for multiple-user factory and warehouse properties, such as Mega@Woodlands and Oxley Bizhub. The demand could have come from firms, particularly in printing as well as event organising, who are downsizing their real estate footprint. Furthermore, Savills notes that some companies in healthcare and the aquaculture industry (i.e. frozen seafood) are also looking to acquire larger facilities to support their business expansion as the pandemic has benefited them. Although there is a growing buying interest among automotive players, especially when there are more single-user factories up for sale, most of them did not translate to actual sales as the prospects are still waiting for better offers before the lease expiry of their current premises. Here’s more from Savills: While some owners maintained their price expectations, particularly for freehold assets, data from JTC showed that overall industrial prices fell by 2.2% QoQ in Q3, making it the largest decline in the last four consecutive quarters. Similarly, Savills’ basket of leasehold industrial properties also continued to register declining prices in Q3. Prices for 60-year leasehold properties fell at a moderate pace of 0.9% QoQ to S$425 per sq ft, while that for 30-year leasehold properties fell by 2.2% QoQ to S$301 per sq ft due to depleting lease terms. As there is a scarcity of freehold industrial stock available currently, especially in prime locations, freehold industrial prices held firm, recording a marginal rise of 0.2% QoQ to S$694 per sq ft.
How office space metrics will evolve post-COVID

New metrics like technology obsolescence and energy balance are emerging. For many companies reassessing their office space amid the rise of remote working, the focus on employee wellbeing and the need to reduce overheads, the old metrics they used to measure how well workplaces perform are no longer enough. Today, metrics that go beyond the traditional space per person or space per desk are being sought so companies can better understand and compare how different offices across a portfolio are really faring – and what needs to change to better position their real estate for the long road ahead.
Hong Kong office rents drop 1.3% in September

Rental decline slowed down compared to the first half of the year.
Sunshine Coast beats Brisbane and Gold Coast in Australian house price growth
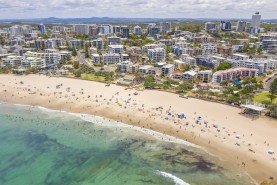
Median house price in the area grew 3.8% to $622,500, and median unit price increased 2.4% to $420,000.
How will Singapore's relaxed restrictions affect the property sector?

The workplace-related changes will boost demand for conference halls, convention centres as well as CBD/Orchard Road retail.
Jakarta retail supply to inch up 3.2% to 4.9m sqm in Q4

Three shopping centers will open in the next six months.
6 COVID-inspired changes developers are mulling over

Over four in 10 developers are changing designs that were once considered complete.
Japan's industrial investment inflows down 20% in H1 2020

But this is due to elevated investment levels last year, not weak investor sentiment.
Tokyo logistics rents post highest annual growth in three years

Given the airtight conditions, rental growth in Greater Tokyo was close to 7% over the year. Even amid a global pandemic, Savills notes Japan’s logistics sector appears to be in good shape. Indeed, with demand supported by the proliferation of e-commerce during the outbreak, the sizeable supply expected over the next few years has done little to deter the market. Yet, whilst some turbulence could emerge over the short-term as the financial resilience of some tenants starts to be tested, the long-term prospects of the sector continue to be driven by the structural changes that e-commerce presents, and as such, rents should follow suit. Here’s more from Savills: MARKET TRENDS Having achieved the milestone of posting the lowest level of vacancy on record in Q1/2020, the Greater Tokyo market repeated the trick in Q2/2020. Specifically, the vacancy rate stands at an even lower 0.4% following a 2.9 percentage points (ppts) tightening year-on year (YoY). Pre-leasing activity remains sound, all things considered, with over 80% of new facilities fully occupied upon completion in 1H/2020. Demand for existing facilities was also strong. In fact, whilst the total leasable area has continued to expand, much of this tightening in vacancy can be attributed to the continued absorption of supply, which has been positive every year since 2017 (Graph 1). This period, for instance, saw net absorption total almost 1.5 million sq m – the most in any half-year period in recent history. Supported by these tight market conditions, rents grew by 6.8% YoY to JPY4,400 per tsubo. Whilst they remained unchanged over the quarter, annual growth was at the highest level in three years. When looking at the submarkets in more detail, the Tokyo Bay area remains the most expensive by some way. Whilst the scarcity of modern large-scale facilities plays an important role in this trend, rents appear to have found a limit, however. Nonetheless, rental prospects for this submarket remain optimistic. Elsewhere, locations defined by their access to the city centre and proximity to transport links, such as the Gaikan Expressway, continue to attract demand. Rents have duly responded, demonstrating solid growth recently. This has been particularly evident in Saitama Prefecture, for instance, where rents have reportedly surpassed the JPY4,000 per tsubo mark for the first time in over a decade. Vacancy rates in Greater Osaka have recovered remarkably since Q3/2017. To wit, the vacancy rate currently stands at 3.0% – a 10ppts decline over the period and a 1.3ppts contraction YoY. More recently in 1H/2020, despite six of the seven projects completed being fully occupied, completions have exceeded net absorption – for the first time since 2017 – and the vacancy rate has slightly increased as a result. Indeed, this change is attributed to some vacancy in the newly completed ESR Amagasaki Distribution Center. Even so, with leasing activity ongoing this uptick should be temporary. Unlike its Greater Tokyo counterpart, rents in this region have surpassed pre-2009 highs. Specifically, they lie at JPY3,990 per tsubo on the back of a historical 10.2% YoY surge. What’s more, following nine consecutive quarters of annual growth, rents in Greater Osaka are only around 9% below rents in the capital. The spread was as wide as 22% only two years ago, further emphasising the recent improvement in market conditions. The momentum in rental growth observed in both regions is encouraging. That said, tenants in the thriving e-commerce sector represent a part of the overall pool. Indeed, some tenants in other constituent industries such as the apparel and manufacturing sectors continue to suffer. Thus, while rents are expected to continue upward, it is not a foregone conclusion. Looking further ahead, when determining rental growth prospects, it is important to consider how the benefi ts created by the structural changes from e-commerce interact with the ongoing issues caused by a national labour shortage. Indeed, notwithstanding the easing concerns over the latter for now, worries are likely to resurface before long. Click here to view the full report.
What's driving the growth of the logistics sector in APAC?

The e-commerce boom is one of the major growth drivers.
APAC real estate investment volumes record softest quarter since 2016

The overall regional volume declined by almost 40% in Q1 2020 at US$117bn.
Most Read
1. APAC prime office rents decline for seventh straight quarter in Q1 2. Singapore private home resale volume drops 7.2% to 2,603 units in Q1 3. What you need to know about Japan’s high-end retail sector 4. Seoul office transaction volume nearly doubles in Q1 2024 5. Brisbane CBD posts highest Q1 office rental growth amongst Australian citiesResource Center

 Advertise
Event News
Event News
EY’s Seng-Leong Teh emphasises focus on resilience, tenant mix management amidst challenges
![EY’s Seng-Leong Teh emphasises focus on resilience, tenant mix management amidst challenges]() Co-Written / Partner
Co-Written / Partner

Discover the insights of Seng-Leong Teh as he navigates the challenges and opportunities shaping the industry today.


Discover the insights of Seng-Leong Teh as he navigates the challenges and opportunities shaping the industry today.