News
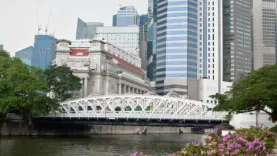
Singapore investment sales volume rises for fifth consecutive quarter in Q2
Singapore investment sales volume rises for fifth consecutive quarter in Q2
Investment sales increased 62% to S$6.18 billion.
What to expect from Malaysia’s residential market in the near term

There is pent-up demand but overall interest is likely to be subdued.
Jakarta’s strata-title apartment sector has yet to recover despite government intervention

Only 575 units were sold until the first semester of 2021.
Hong Kong residential price gap between Kowloon, New Territories shrinks by 20ppt over 10 years

New projects in the New Territories are now 21% cheaper than those in Kowloon.
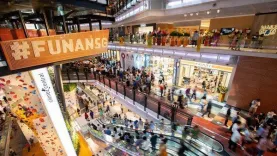
Singapore private condo sales down 6.8% to 6,723 units in Q2

There were no new project launches in June.
3 new office buildings to watch out for in Osaka

The Osaka Umeda Twin Towers South will lead the supply throughout 2022.
Commercial property investments in regional New South Wales gain momentum

Newcastle, Wollongong, and Gosbord are attracting hefty investments.
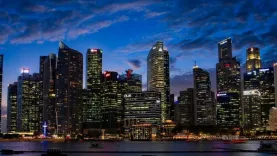
SG property investment sales recover to pre-COVID levels: Colliers
Investment sales surged to 86.3% in the second quarter despite tightened restrictions.
Property investors remain attracted to offices in Japan’s regional cities

One company will invest US$10b in Japan, 70% of which will be invested in office buildings.
Hong Kong investment volume surges 168% to USD3.3b in Q2

Institutional investors accounted for 71% of all commercial transaction volumes in the quarter.
Australian industrial transaction volumes hit $8.6b YTD

This was boosted by two Blackstone portfolio sales - Milestone ($3.8b) and Kingdom II ($825m).
Japanese office rents in regional cities faring better than in Tokyo

Rents in Tokyo dropped 6.5% while Osaka and Nagoya recorded only 2.2% and 0.6% declines, respectively.
Singapore prime office occupancy rate rises for the first time since COVID hit
Occupancy rate in the Raffles Place / Marina Bay precinct reached 94.3% in Q2.
Australia’s office leasing markets show signs of recovery in Q2
One of the demand drivers were tenants seeking small spaces of less than 1,000sqm.
Property investors urged to focus on cold storage in the next 3 years

Hong Kong’s strong export rebound and rise in food consumption would increase this asset’s value.
Singapore prime retail rents down 11% as tourists remain non-existent
Island-wide rents declined 9.3% to S$26.20 per square foot per month in Q2.
Hong Kong high-street rents to fall by 3% this year

This is a huge improvement from the 28% drop recorded in 2020.
Most Read
1. Build-to-Rent moves from niche to necessity in Australia: analyst 2. Singapore CBD office vacancy hits a nine-quarter low 3. Singapore retail rents expected to rise up to 2% this year 4. Hong Kong retail market becomes increasingly polarised 5. Luxury home prices in Hong Kong to rise up to 8% in 2026Resource Center
 Advertise
Event News
Inside Frasers Hospitality Asset Management’s win at the Real Estate Asia Awards 2026
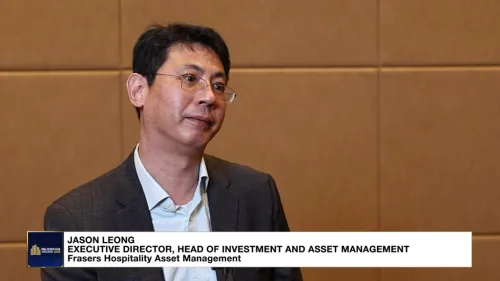
Jason Leong of Frasers Hospitality Asset Management shares how the company identifies and responds to evolving consumer trends.